
Bar graphs are so much a part of birding publications nowadays, e- and paper, that it’s tempting to think they were always there. They weren’t: only in the past thirty years or so, and largely thanks to its use in the ABA/Lane guides, has the bar graph passed from a welcome novelty to an expected component of finding guides and local ornithologies.
That’s not to say, of course, that such things are entirely new.
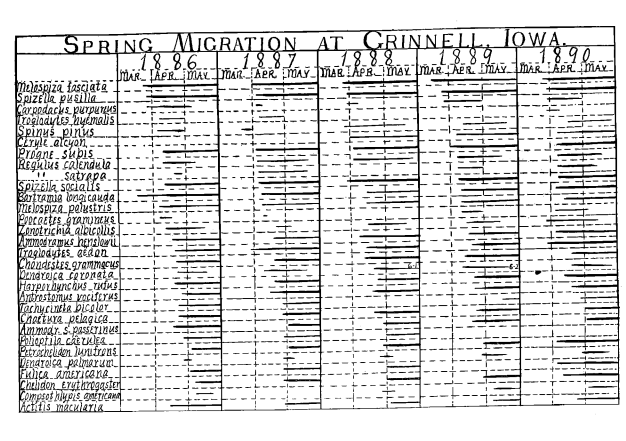
In 1895, having taken up his position at Oberlin, Lynds Jones decided to publish the results of five years’ “systematic study of bird migration” in central Iowa. Over five full pages, he arranged 110 species in the sequence of their usual springtime arrival:
In these charts an attempt has been made to indicate not only the dates of arrival and departure … but the time of arrival or departure, or both, of the bulk of each species. This is indicated by the heavier portion of the lines opposite the name of each species, the lighter portion indicating simply its presence….
Was Jones the first to publish bar graphs showing the seasonality and abundance of birds? Let me know if you have any earlier examples.
